Footprint Analysis
Occasionally the need arises to inspect where a group of rays intersected with a number of surfaces along the imaging path... in sequential software this is often done with a Footprint Analysis Diagram. FRED does not have an out of box Footprint Analysis, but with a little effort we can create a similar view of where the ray set crosses the surfaces.
Example
Download the FRED file: Footprint Analysis.frd
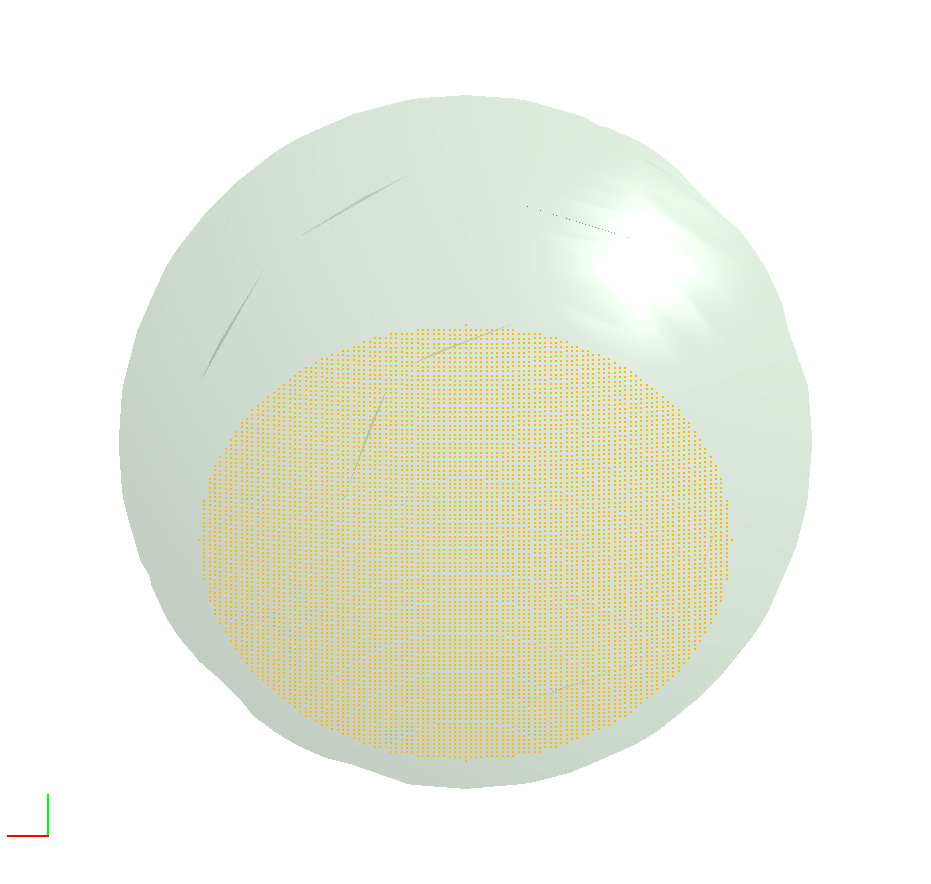
The file comprises a simple Tessar lens system with a source representing the off-axis field. To see the Footprint across all surfaces simply run a trace and then, in the Analysis menu, call the Visualization 3D Spot Diagram and accept the default settings.
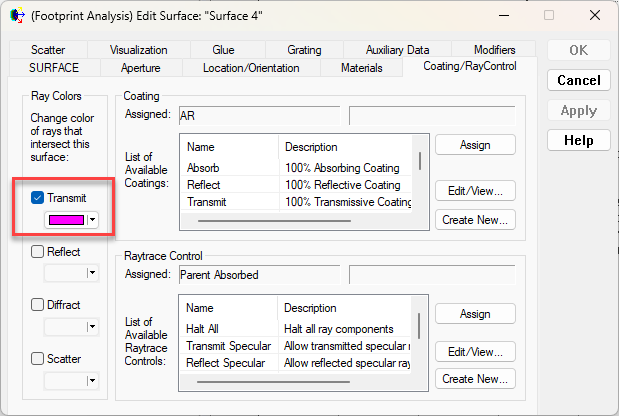
The "trick" to this file is that the surfaces we would like to see the footprint on have a coating defined which permits absorption, and the raytrace control on those same surfaces also permits absorption and ensures no child rays are generated. It is these absorbed rays that are plotted in the 3D Spot Diagram.
The coloration between surfaces is achieved by changing the ray color at each intersection using the "Coating/RayControl" tab on each surface.
If we require to see the footprint 'side on' for a particular surface then we can do this by:
- Rotating the view so Z is into the screen (choose "+x left, +y up")
- R-click on the surface of interest and choose to "Isolate and Fit View to Selection"
- Re-run the 3D Spot Diagram and choose to filter "rays on surface" and choose the same surface that was isolated in step 2.
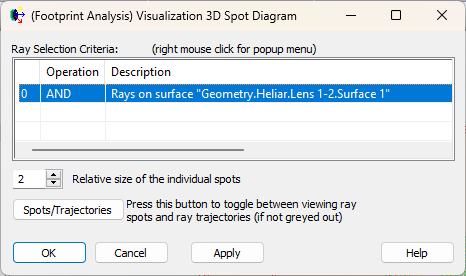
Which then gives the rays and surface of interest (and hides all the others):